The data will be in the "Output" Window. Print the output in the following manner:
2. Click on "File"
3. Click on "Print"
4. Click on "OK"
In the output of the t-test one set of data is labeled group statistics as follows:
WORTH Animal 5 5.80 .84 .37
Human 5 3.80 1.64 .73
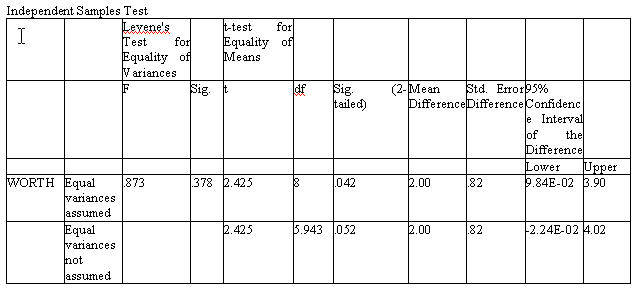
The mean for animal cartoon characters is 5.80 while the mean for human cartoon characters is 3.80 on the question of In the past week how often have you spent a worthwhile day? The animals appear to have higher ratings on the item than do humans. Whether that difference is statistically different is answered in the next set of results. There are two types of tests of significance in the output. (1) Levin's test for equality of variances does not test for the difference between means but tests for a difference between the variance of the two groups. This is a test of one of the assumptions of the t-test (that of homogeniaty of variances that is that the variances are the same). However, it has been shown that such inequality does not necessarily invalidate the results particularly if the procedure for inequality of variances is used. Consequently, if the F-test for equality of variances is not significant then the standard procedure is used. If the F-test for equality of variances is significant then the procedure for unequal variances is used. The results of this data show that there is not a significant difference between the variances (the significance of F is .378 and therefore not significant) and the procedure for equal variances is indicated. The 2-tailed test of significance is .042 and is significant because it is less than .05.
Assume that the results were obtained from the characters themselves and the following is a possible report of the data. Part of the fictitious methods section might read something like the following:
The Results Section might contain the following: