Graphic Representation of Sums of Squares ANOVA
The t-test can be shown graphically in terms of the General Linear Model to develop understanding.
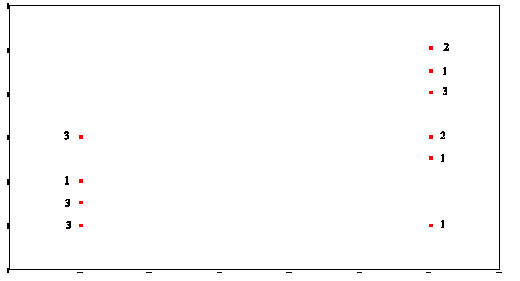
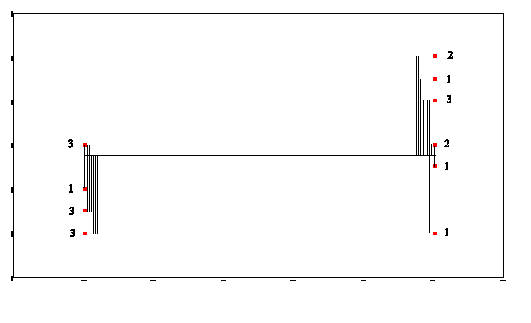
This plot represents two variables DEPRES and GROUP. There were three people in GROUP # 1 who answered 0 to the question of "sad or depressed." If you look back at the raw data you will that was participants 1, 5, and 6. There was one person in GROUP # 2 that answered the question as 0. In looking at the raw data you will see that it was person # 16. There were two people in GROUP # 2 that answered the question as 8. There were person number # 12 and person # 14. This scattergram represents all the people of both groups. Once again the scattergram represents a relationship. The smaller going with the small and the large with the large. People in GROUP # 1 gave responses which were smaller and people in GROUP # 2 (2 is larger than one) gave responses which were larger than those in GROUP # 1.
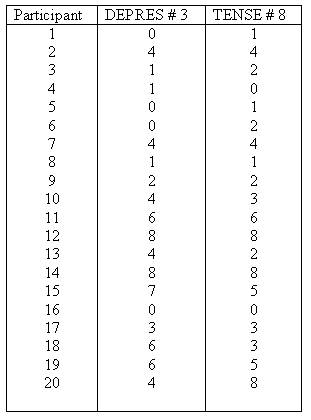
The two variables DEPRES and GROUP follow:
D
E
P
R
E
S
E
P
R
E
S
GROUP
Group #1 Group # 2
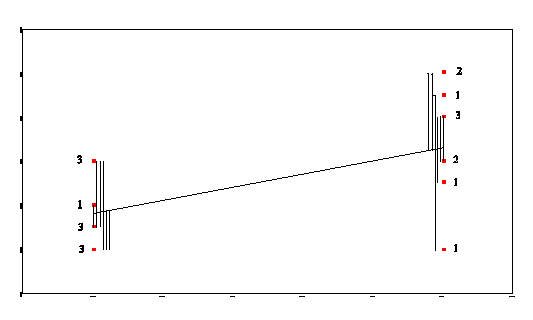
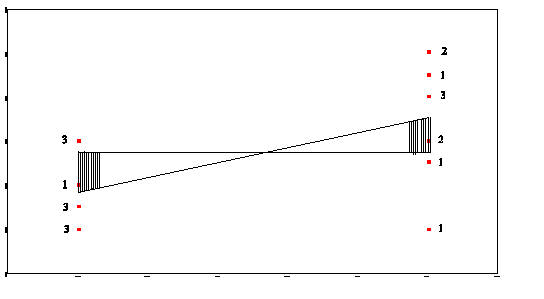
Sum-of-Squares-Residual (or Sum-of-Squares-Error) are generated by taking the distance from each data point and the regression line, squaring it, and adding all of the squared distances together.
Sum-of-Squares-Regression (or Sum-of-Squres-Between) is generated by taking the distance from the mean of Y and the regression line and squaring it. This is done for each data point. Each of these squared distances is added together to become the Sum-of-Squares-Regression (Sum-of-Squares-Between).
The Total-Sum-of-Squares is generated by squaring the distance from the mean of Y and each data point and then summing the squared results.
GROUP # 1
