This example deals with only items # 3 and # 8 of the questionnaire. Those questions were "In the past week how often have you felt sad or depressed?" and "In the past week how often have you felt tense?" and are labeled as DEPRES and TENSE respectively. A discussion of the correlation between responses to these two items (items 3 and 8 on the questionnaire) follows.
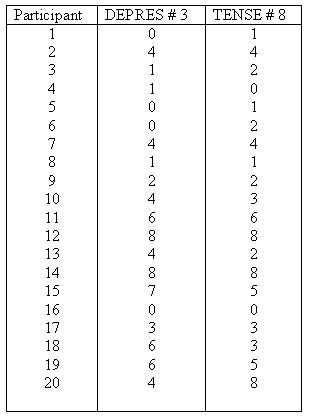
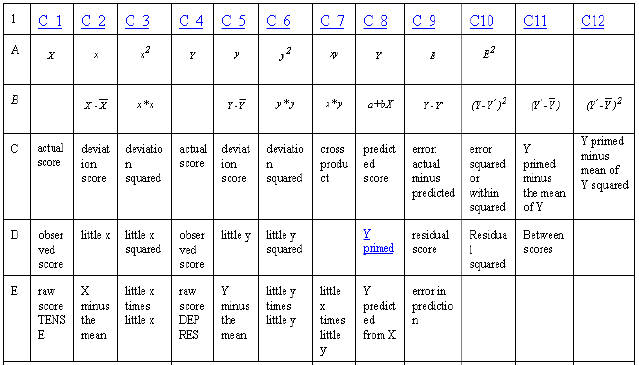
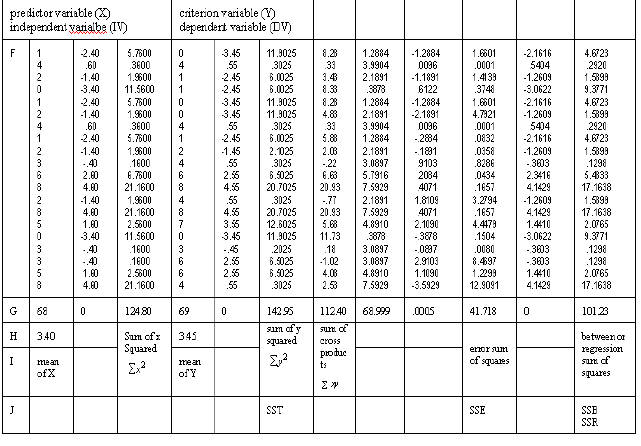
Table 2-3. Rows A through F are either mathematical notation or verbal description of mathematical calculations of the numbers in the column. Rows 1 through 20 are associated numbers involved the calculation. Row G is the sum of the numbers in the column while row H is the mean for the column. Row I is the usual verbal description of the sum in the column and row J is an abbreviation of that description.
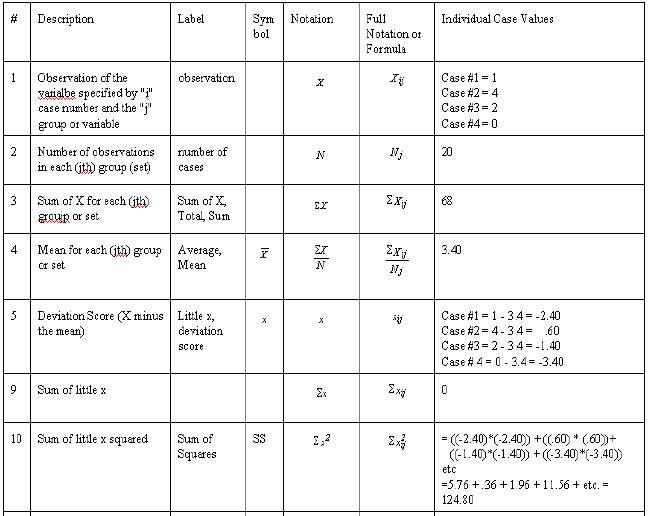
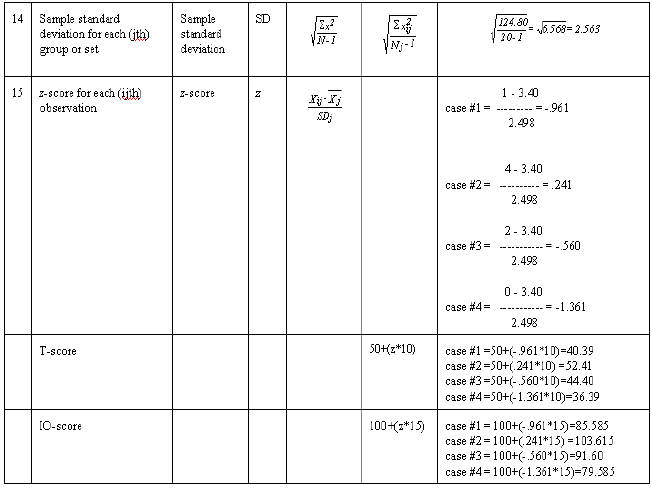
In the example below when there are scores for all 20 cases are individually computed only the first 4 will be given (this occurs with observation, little x, Y' and SSE).