Coefficient Alpha Method of Assessing Reliability
In this example we will again use the data from the Psychosocial Assessment Scale.
The subscales in this example are:
1. Negative Emotion made up of items FEAR, DEPRES, ANGRY, CONFUS and TENSE.
2. Quality of Life made up of LEISUR, FEELG, WORTH, SATISF and USELES. [USELES would be reversed.]
3. Human Contact made up of OUTSID, TALKTO, CONFLT, and SUPPRT. [CONFLT would be reversed.]
4. Job or Employment made up EMPLOY, GOODJ, LIKEW and INWAY. [INWAY would be reversed.]
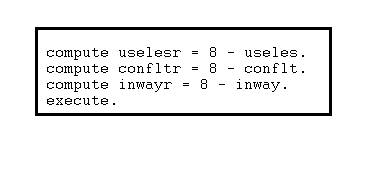
For our purposes here the items USELES, CONFLT and INWAY need to be reversed. The following syntax provides that reversal.
Now instead of use the variables USELES, CONFLT AND INWAY one should the variables USELESR, CONFLTR and INWAYR if the subscales are positive.
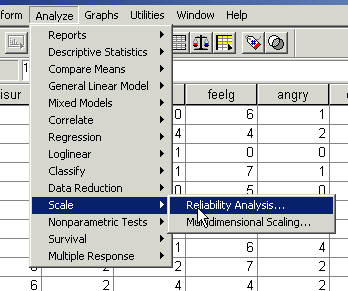
Click Analyze
Select Scale
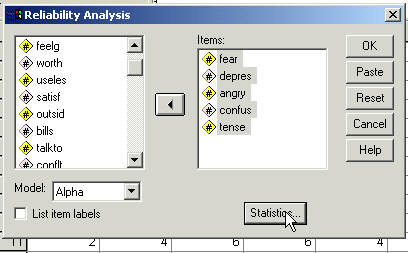
Click Reliability Analysis...
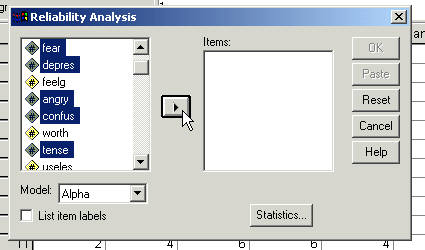
Select the variables for the subscale and click the "right delta"
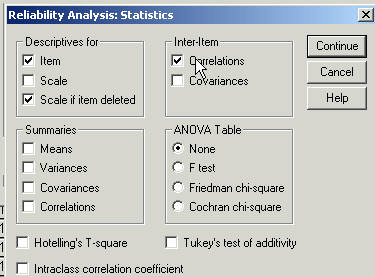
Check Item, Scale if item deleted and Correlations
Then Click Continue
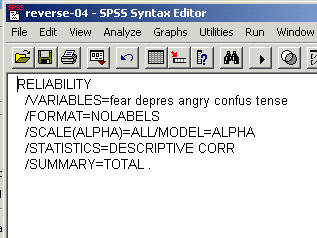
The Paste produces the following syntax file.
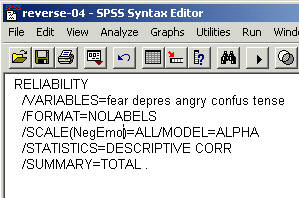
Change the /SCALE(ALPHA)=ALL
So that it looks like the following with the name of your subtest.
I changed this one for negative emotions (NegEmo) see above.
Run the syntax file.
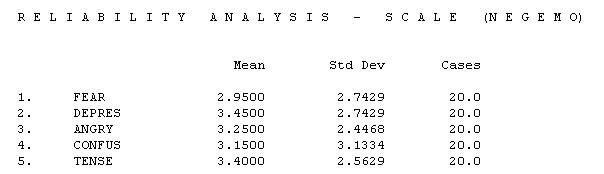
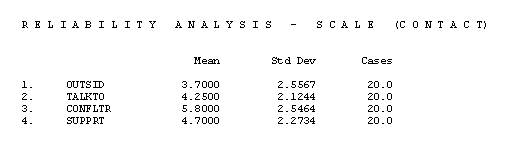
The first part of the output is descriptive.
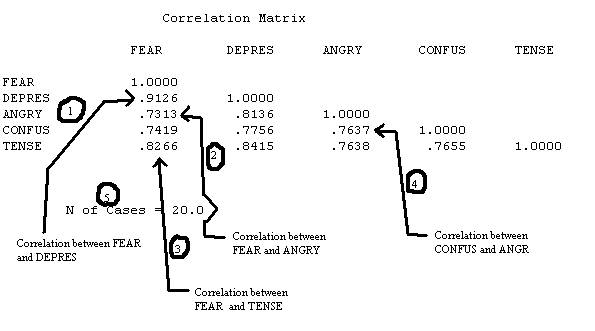
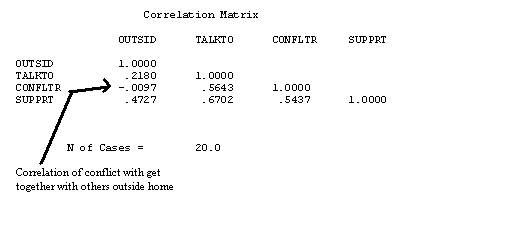
In the next section of the output there is the correlation matrix and the number of cases used in the computation. The number is the correlation between FEAR and DEPRES.
The number shows the number of cases.
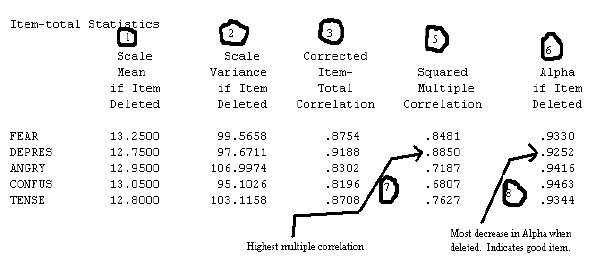
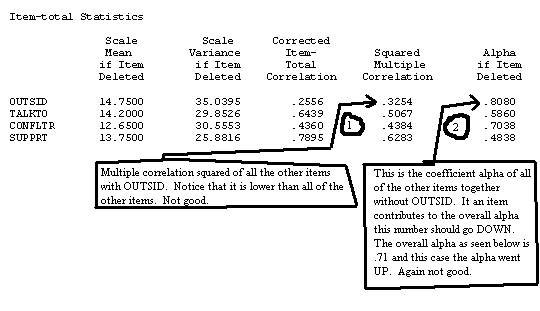
In this next section of output item characteristics are identified by what happens when they are dropped. Good items are identified by what happens when they are good. Things go downhill when the best players leave a team.
The most useful might be column What happens to the Alpha value when the item is dropped from the subtest?
We see that the Alpha goes down the most when DEPRES is dropped from the subtest. On this characteristic it would be considered the best it.
DEPRES is also seen to have the highest Squared Multiple Correlation.
Another characteristic of a good item.
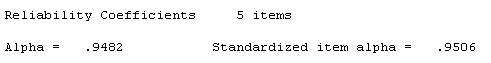
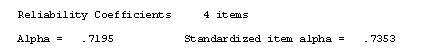
Finally we are looking for the Reliability Coefficient of Alpha.
The Standardized Item Alpha first converts the scores of each respondent to a standard score before computing the coefficient alpha.
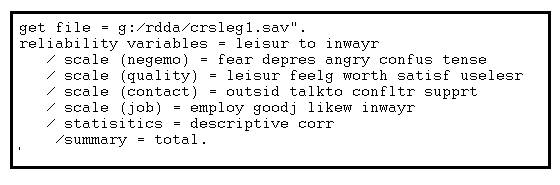
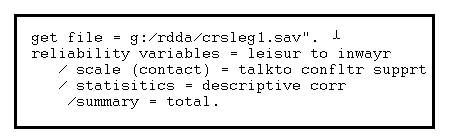
When there is more than one subtest it might be more efficient to use a syntax than the "clicking methdo." Below is a syntax file that will run reliabilities on four subtests. Notice that the reversed variables are used (uselesr, confltr, and inwayr).
Some items need to be reversed when the item stem implies an opposing direrection. For example, in the "Quality" scale the items LEISUR, FEELG, WORTH, SATISF are in the positive direction (LEISUR--have you felt good about your leisure hours? FEELG -- have you felt good about things you have done?) while USELES was negative (USELES -- have you felt useless?). USELES is reversed and the reversed result is put in the variable USELESR.
The alpha coefficients for each of the subscales are:
1. Negative Emotions (negemo) was .93
2. Quality of Life (quality) was .92
3. Human Contact (contact) was .71
4. Employment (job) was 94.
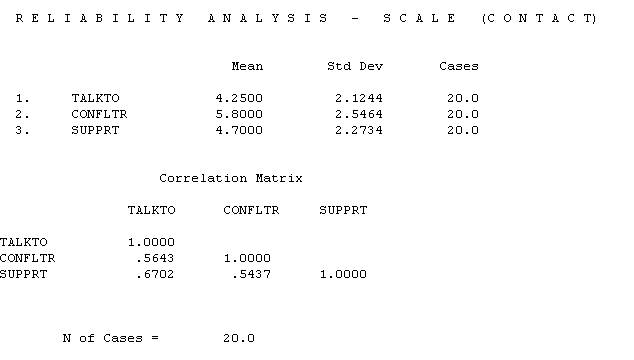
Only the CONTACT subscale will be discussed here to point out the variaous characteristics of the the output from SPSS. First is the means, standard deviations and number of cases.
Next the correlation matrix is printed showing the correlation of each item with every other item. The arrow points to a problematic correlation. Since it is assumed that each item of a subtest is measuring the same thing each item should correlate highly with every other item. The correlation of CONFLTR with OUTSID is essentially a zero correlation. Note also that OUTSID correlates poorly with all of the other variables.
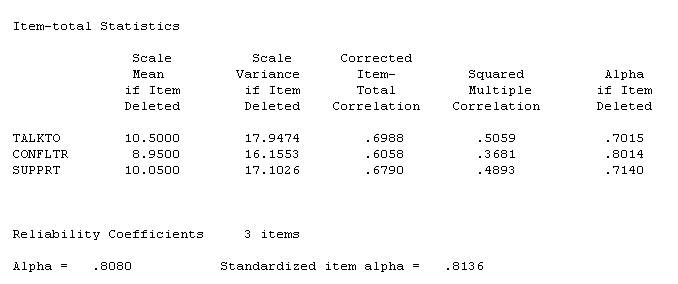
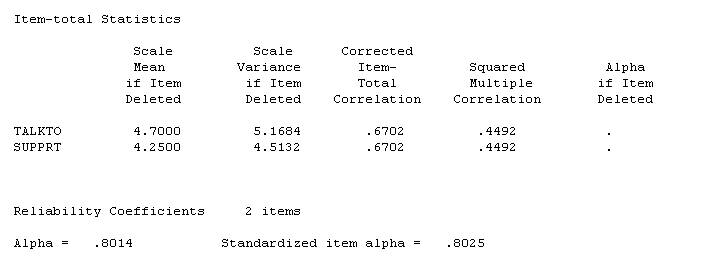
Next is the Item-total Statistics. Mostly we are interested in the Squared Multiple Correlation and Alpha if Item Deleted.
Again we see that the item OUTSID is problematic. The analysis should be computed again without the variable OUTSID. Actually we know what the result will be. It will be .8080. However, we will get new diagnostic data. The alpha in this run follows:
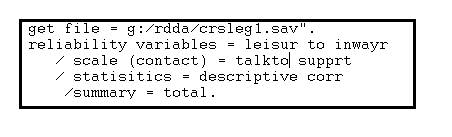
The criteria for the strength of alpha for including a variable in a test is not settled. Some say it can be as low as .70 while others say the lower cutoff should be .80. I believe that the item OUTSID is not a good measure of our subscale. Next will be a recomputation of the subscale without the item OUTSID. The syntax file is shown.
And the first part of the output.
This part did not change from the last run.
The remainder of the output follows:
The alpha is .80 but still the Squared Multiple Rs are not great and somewhat lower than the original run. Lets try one more.
Not much change. The multiple Rs have not improved. I don't think this is much of a test (in this instance subscale.)
NOTE: The Coefficient Alpha has at least three different names: (1) Internal Consistency (2)Coefficient Alpha, (3) Chronbach's Alphs, and (4) Alpha. They are used interchangably here.
Which items to reverse? The name of the scale might be one way to decide. For example, above the name of the first scale is Negative Emotion. One might expect that a high score on such a scale would indicate high negative emotion. So that none of the items of fear, depression, anger, confusion and tenseness would be reversed. However, on the scale Ouality of Life where you might expect a high score to represent a high quality of life the negative emotion of feeling useless would be reversed.