Split-half Method of Assessing Reliability

Using this method you take half the items, and correlate them with the other half and that correlation is the index of reliability. The assumption is that all the items are measuring a single variable. Because the items should be comparable they should be considered interchangeable.  It should be noted, however, that is this interchanability that we are testing when we test reliability.

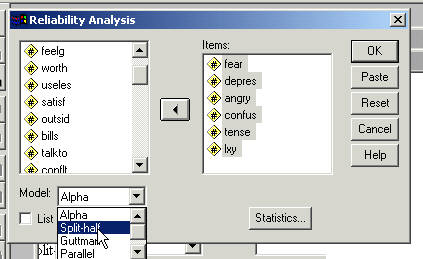
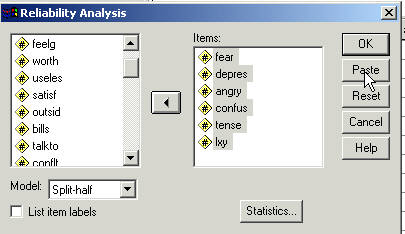
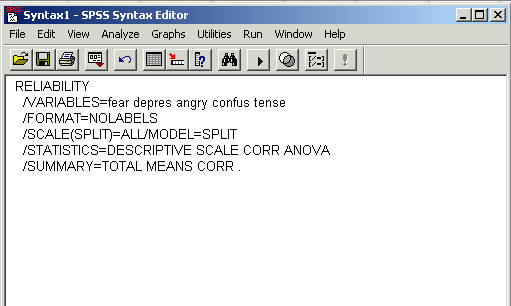
Only one subscales of the questionnaire is assessed in this problem (it takes up too much paper to do them all -- in the coefficient alpha below all subscales are assessed).  The following "click" procedure with produce a syntax file that we will change slightly for our purposes.  The "click" method will not give us exactly what we want.
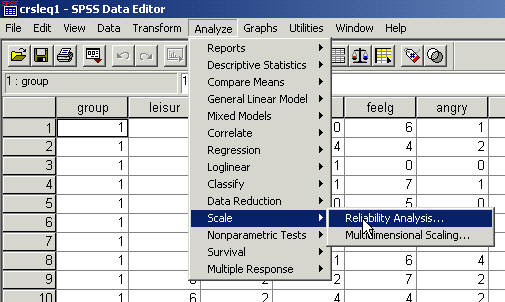
As you can see in the upper left hand corner we are using a file called crsleq1.  It is an .sav file. 
Click Analyze.
Select Scale
Click Reliability Analysis.
The following window appears:
Select fear, depres, angry, confus, and tense by holding down the Ctrl key and clicking those variables and seen in the next screen.
Then click the "right delta" as seen next.
The variables will appear in the "Items:" window -- next.

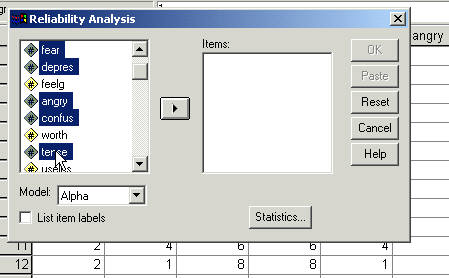
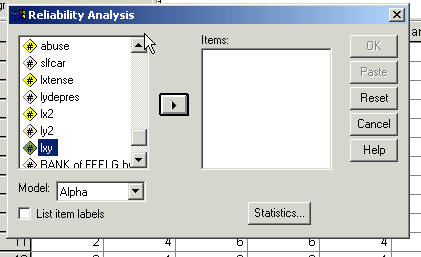
Click the "Pull Down" box that has Alpha in it.
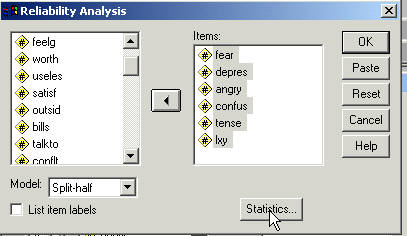
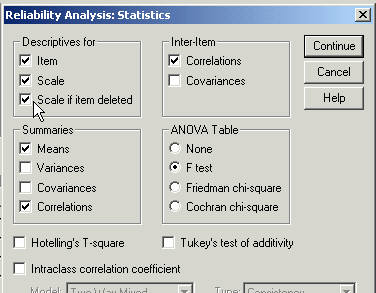
Click Split-Half

Click Statistics

Check Item, Scale, Scale if item deleted, Correlations, Means, and a second Correlations.  See next screen.  Then click Continue.
Click Paste
The following Syntax File opens.
The following changes need to be made to that file:
Where it says "/SCALE(SPLIT)=ALL/MODEL=SPLIT" you need to change it so it reads as follows:
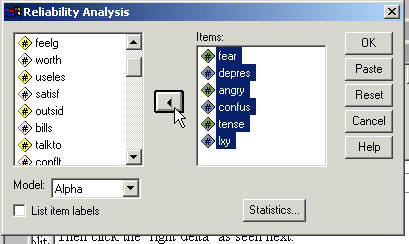
"/SCALE(NegAffect)=ALL/MODEL=SPLIT".
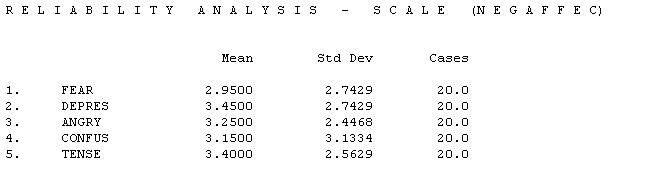
Now in the printout the scale of fear, depres, angry, confuse, and tense will be lableled NegAffect.
Save and Run the Syntax File
This first part of the output seems pretty much self descriptive.  The name of the subscale is NEGAFFEC.  It cut off the t of affect.  It was supposed to be NegAffect for negative affect.  The means, standard deviations and number of cases for each variable seem clear.

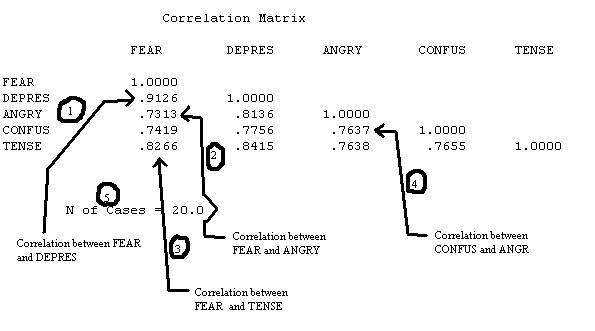
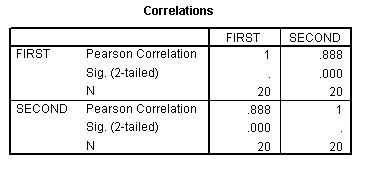
In the next section of the output there is the correlation matrix and the number of cases used in the computation.  The number                    is the correlation between FEAR and DEPRES. 

The number              shows the number of cases.

In this next section of output item characteristics are identified by what happens when they are dropped.  Good items are identified by what happens when they are good.  Things go downhill when the best players leave a team.
The most useful might be column                   What happens to the Alpha value when the item is dropped from the subtest?
We see that the Alpha goes down the most when DEPRES is dropped from the subtest.  On this characteristic it would be considered the best it. 
DEPRES is also seen to have the highest Squared Multiple Correlation.  
Another characteristic of a good item.
Below number                   is where we are trying to get to.  It is the Split-Half Reliability.


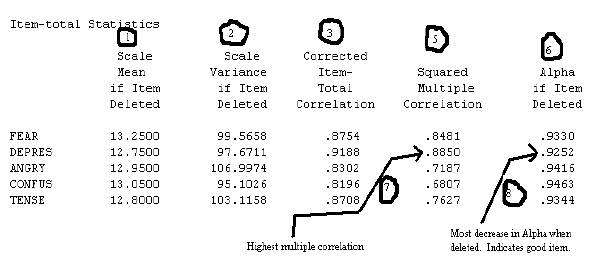
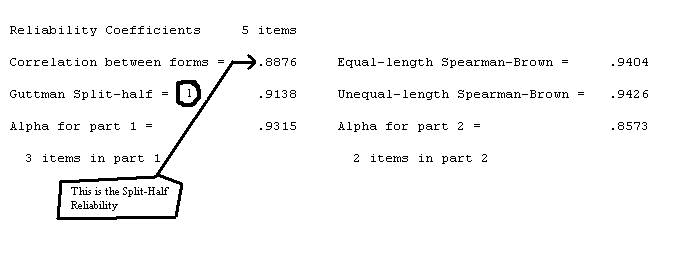
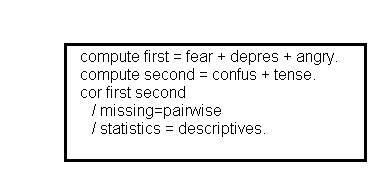
The Split-Half Reliability coefficient is the same as summing the items of the first half and summing the second half and then correlating the two results. This is demonstrated in the next example.

The above syntax produces the following output.  Notice that the correlation is the same (after rounding) as the Split-Halt Reliability above.  Consequently, it is the split-halt reliability.